2016 has been a surprising year. Then, if one would like to look back and attach a meaning to it, what could he do? What economists most oftenly prefer to do, is to look at indexes.
Then, since we are concerned about the environment, Steamgreen has selected an interesting one in order to conclude this year and launch a bird’s eye view to 2016.
The EPI index
The Environment Performance Index is in practice a index of indexes, born in 2002 out of a joint study carried out by eminent Universities, such as Yale and Columbia, and partnered by the European Commission and the World Bank. The focus is on the relative performance of countries in two main areas: protection of human health and of ecosystems. But the outcome is a number, therefore the indicators gathered are outweighed through statistical transformations, which basically say the greater the number, the better the situation down there. Or even better: the greater the number, the better the situation, the closest is the country’s environmental policy to the generally agreed standards, as defined by national targets, recommendations issued by organisation such as UNEP or scientific studies. In particular it has been attached to the UN Millennium Development Goals.
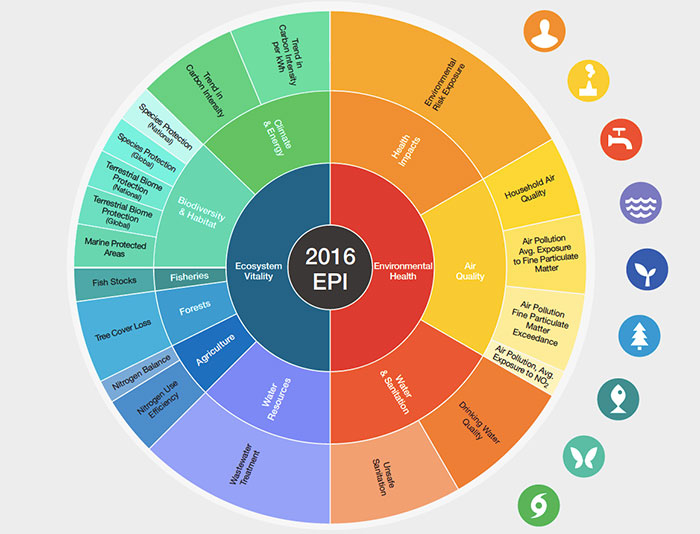
The original indicators belong to nine fundamental areas:
- Health impacts
- Air quality
- Water & sanitation
- Water resources
- Agriculture
- Forests
- Fisheries
- Biodiversity and Habitat
- Climate and energy
However, the indicators and the related categories may change over time due to quality and availability of data and to relevance, of course.
This is the one used for 2016 computations:
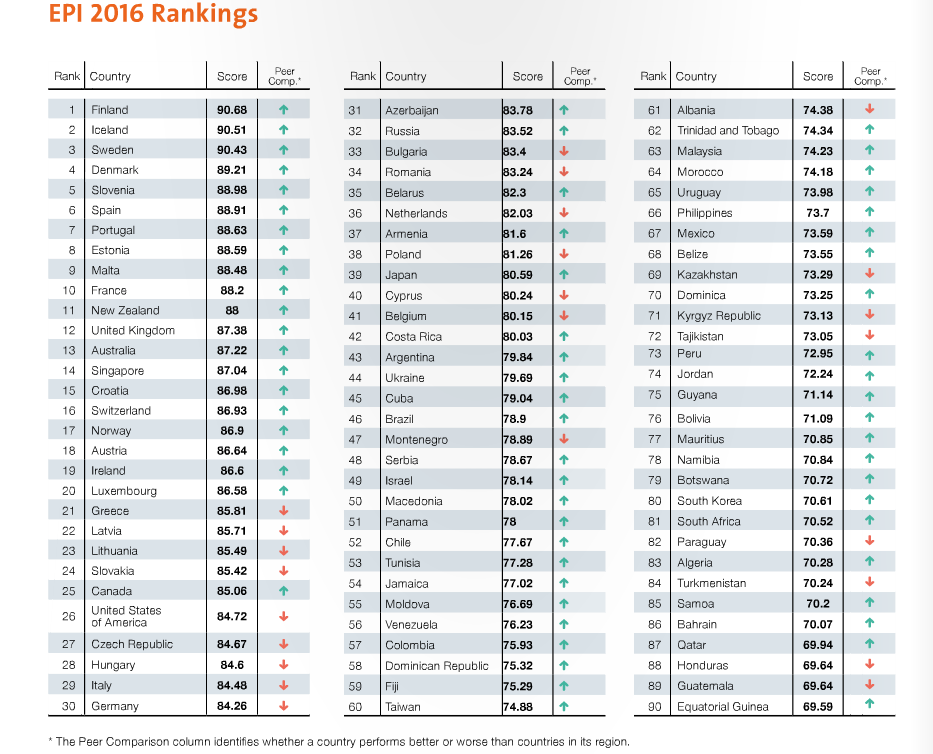
Results
The biannual results are pretty interesting because they are relatively varying over time and most of all because they allow a comparison along peers.
this year’s chart is illustrated below:

What is interesting to notice about this EPI findings is that finally a quantitative measure has been used in order to identify regional environmental strategies. Indeed, very often the media report news of isolated innovations or policy structures, and scientific studies speculate about concentrated areas when it comes to results. In this case, almost all the world is ranked and evaluated, and this gives an inegiglible significance. Of course, it isn’t fully comprehensive, as only some indicators are selected and a partial view of a country’s effort is offered. For example: this year Finland is on top, given that the country has rendered some carbon-neutral society targets legally binding. However since the index doesn’t account for nuclear risk, it also ignores the fact that in Finland 30% of electricity stems from this resource (World Nuclear Power Association).
Notwithstanding the strength of EPI lies also in easiness and simplicity. It teaches to policy makers an important lesson: what is measured can be improved. And the study affirms that there is positive correlation between tracking results and policy improvements.
Another side, as the chart shows by itself, is that there is undeniably a positive correlation between GDP and EPI. That is to say: when a country has urgencies to care about, it cannot focus on environmental issues. However richness isn’t always the answer to our problem, as economic development is most of the times carrying environmental hazard and health threats, as demonstrated by the index of air particulates.
Among the notable trends that pop out of these data in fact there is that more than half of the global population live in areas where the air quality is very poor. Air quality is together with fish stocks and deforestation the main drive of environmental risks according to the disposable indicators.
The good news, instead, since the EPI has been recorded, is that the overall performance is generally improving from time to time, protection of ecosystems has been enlarging and that people’s access to drinking water has been improving.
You can read the full report here.
Curious to see what happens in the future? Let’s see the next report, that will be issued n 2018. In the meantime happy holidays to all of you!

