Regardless of the degree of agreement that surrounds the term “Anthropocene” within scholars debates, it is recognized that human activity had an impact on Planet Earth.
Nevertheless, there is significant disagreement on the term “Anthropocene”, following the need of establishing a Global Stratotype Section and Point (GSSP) that individuates a homogeneous change in stratigraphic material (Lewis & Maslin 2015).
A problem of approach, rather than substance. As there is no territorial homogeneity, which geology requires following the GSSP method, some scholars (Crutzen 2006, Steffen et al. 2008) identify the turning point in the industrial revolution, while other approaches encompass from the end of the last glaciation to the first nuclear fallout (Lewis & Maslin 2015).
A significant benchmark in this discussion has been established with “The Anthropocene: Are Humans Now Overwhelming the Great Forces of Nature” (Steffen et al. 2008), where the authors use carbon dioxide concentration as a benchmark for signalling human activity as a major force of nature, therefore disruptively disturbing the natural systems established over millennia.
While the interconnected relationship between humans and their surroundings have been already acknowledged two decades before in the Brundtland Report (1987), the difference between Holocene human development and anthropogenic change is embedded in the nature of such change, in other words, as postulated by Rockström et al. (2009), in the degree of anthropogenic pressures on the Earth System.
Such postulation can effectively introduce the problem into a system analysis approach: analysing whether balancing feedback loops will pass their breakdown point, causing a shift of dominance to destructive runaway loops.
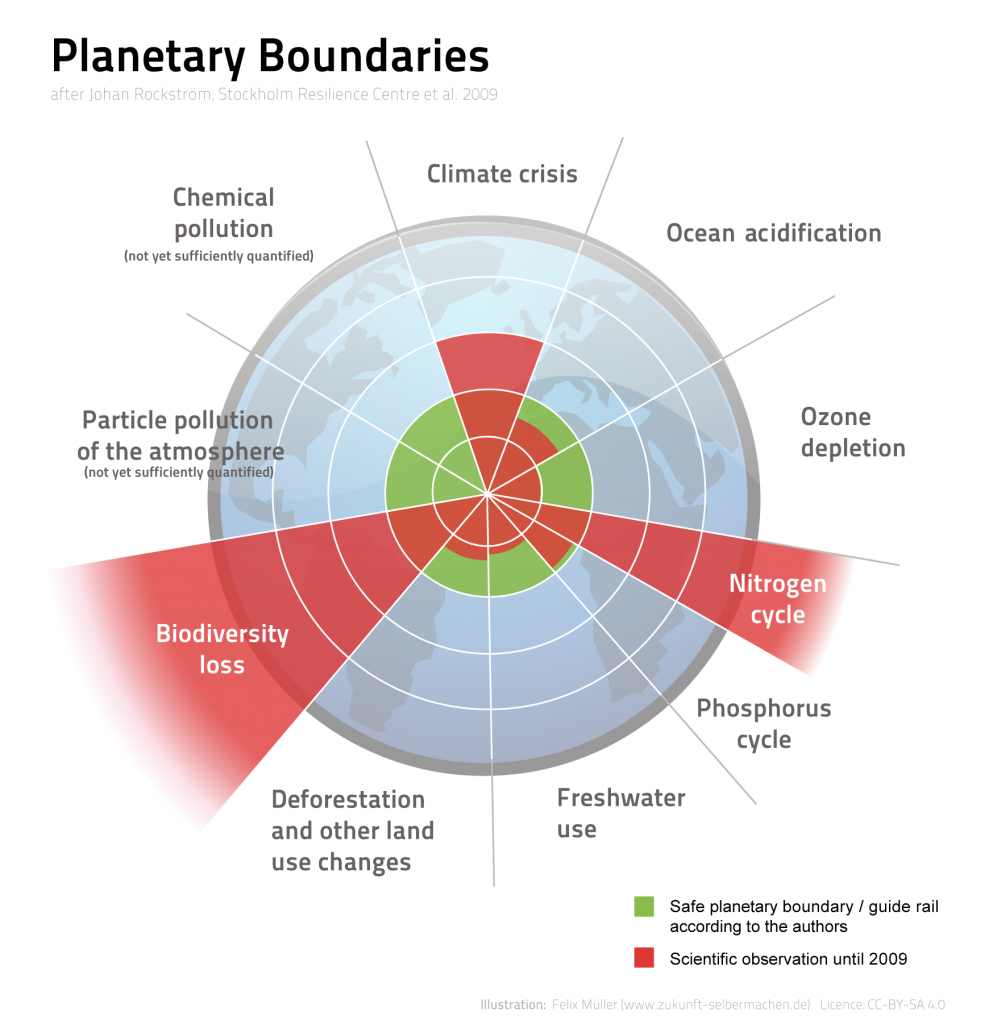
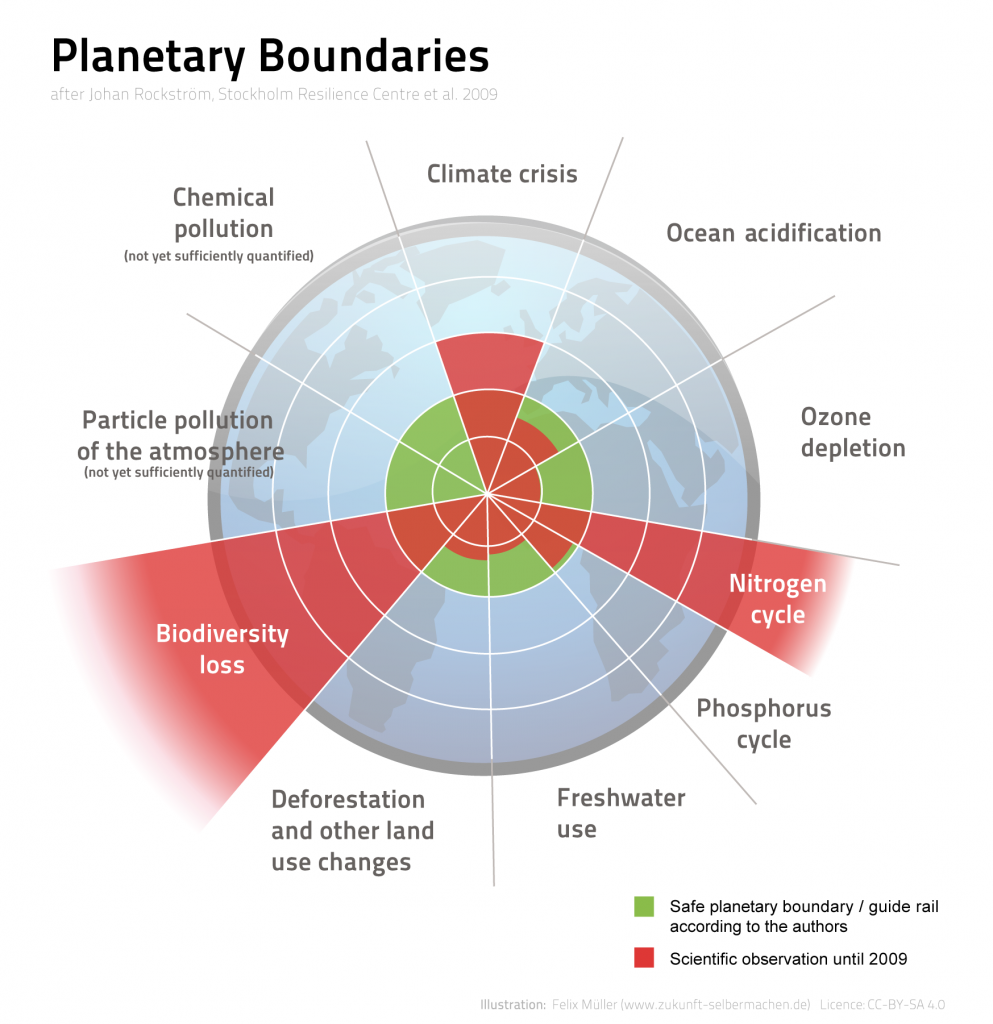
Such analysis of stocks’ behaviour is encompassed by the identification process made with Planetary Boundaries (PBs) (Rockström et al. 2009). Here, nine “danger zones” that will cause irreversible damages for humanity are addressed.
Three of them already overshoot the limit set by the Planetary Boundaries Framework: Climate Change, Biodiversity Loss and the Nitrogen Cycle, for which unpredictable cathastrophic reductions of ecosystem stocks have already been triggered.
To better understand their consequences on human development and ecosystems survival in the following section we cover two of them: ocean acidification and the global phosphorous and nitrogen cycle.
Ocean Acidification:
Talking about an isolated PB is somehow reductive, as overshooting one threshold might trigger a resonance effect on most of the other PBs. Ocean Acidification threatens both marine biodiversity and climate change mitigation.
Oceans, like forests, are Earth’s lungs: an excessive stock of CO2 in the atmosphere increases the absorption rate of the ocean, which turns CO2 into H2CO3 (carbonic acid), lowering the pH of the seawater. Among several effects on marine biota, this triggers diffuse depletion of organisms’ calcium carbonate structures, or aragonite, caused by a “dissolution flow” which affect those corals and organisms that rely on it, subverting ecosystem equilibria (i.e. altering competitive interactions) (Kroeker et. al 2012).
The PBs Framework establishes the tipping point at 80% oceanic aragonite saturation (Ωarag= 2,75), with base-condition at pre-industrial levels of Ωarag= 3,44 (where Ωarag = 1 identifies dissolution).
While the existing acidification rate increase of 16% w.r.t. pre-industrial levels (Ωarag= 2,90) has already triggered some non-linear effects (Ries et al. 2010, Milazzo et al. 2019), applying sensitivity analysis to this phenomenon still withholds a significant degree of uncertainty on the full extent of its backlashes.
Nitrogen and Phosphorous Cycle:
Human activity is not self-constrained to industrial production. For sustaining its birth-rate growth, mechanized agricultural processes are needful. While increasing soil fertilization, an increase in the nitrogen compounds stock at regional levels (Rockström et al. 2009) flow into rivers, aquifers and oceans. This is one of the many human activities that impact these cycles more than all terrestrial processes.
The effect on ecosystems are several: i.e. an excess of nutrients conducted downstream (flow) increases algae proliferation (stock), increasing the bacterial absorption rate of oxygen (flow) and reducing deep water living biota (stock).
Like nitrogen, phosphorous causes eutrophication, and therefore anoxia, by providing excessive nutrients to marine algae, thus favouring their dominance on other marine living creatures.
The same phosphorus deposit on the seabed that, due to weakening the ocean conveyor belt caused by climate change, leads to the stagnation of such nutrients, subsequently altering their slow and fast cycle.
According to Rockström et al. 2009, their threshold levels are respectively 35 million tonnes per year of Nitrogen removed from the atmosphere and 11 million tonnes per year of phosphorous taken from rock formations.
While the current status of phosphorous is still within a “safe operating space”, Nitrogen has crossed the acceptable Planetary Boundary and entered the “danger zone” (currently at 121 million tonnes per year).
Here as well, some non-linear effects have already been triggered, as in the case of oligotrophic water bodies into turbid eutrophic ones mentioned above (Carpenter et al. 1999).
Building Resilience:
As for adapting mechanisms of threatened life forms, a “resilience” factor of resistance can benefit ecosystem response to sudden changes. A strong connective system can recover endangered coral reefs when the damage is local. As human-caused changes in ecosystems are typically faster than natural adaptation capacity, humans can reproduce resilience by supporting systems’ adaptive responses, foreseeing change and taking countermeasures upfront (Scheffer et al. 2012). Another example is building up strategies for preventing eutrophication in lakes (YongHong et al. 2010) or promoting efficient practices for nitrogen use in crops (Masclaux-Daubresse et al. 2010).
Among the limitations of the PBs framework, Downing et al. 2020 identifies a problem of waste accumulation rather than only resource limitation, developing a resource-producer-consumer-waste (RPCW) model, therefore adding a significant variable to the equation that can be managed through resilience thinking.
Dynamics of System Change:
To evaluate strategies for sustainable management, one should look at natural behaviour over millennia, where adapting organisms have resisted or perished to change.
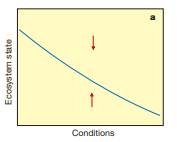
Analysing the graphs (Figure 1-3) proposed by Scheffer et al. (2001) we can better understand the potential behaviour of such systems when changing conditions arise.


The X-axis in the figures below represent an input flow affecting a stochastic event (i.e. increase in nitrogen compounds conducted downstream or ocean absorption rate of CO2). The Y-axis, on the other hand, is the state of the stock into analysis itself (i.e. coral reef or algae).
The arrows indicate within a given condition if the stock proliferates or faces a reduction (direction of change). Taken this into account, the slope of the curve represents the magnitude of ΔS (difference in stock, which also represents sensitivity) at f+1 (an increase of the flow).
Taken this into account, stability can be understood by looking at the slope of the system over time (Figure 1 and 2), where only one equilibrium exists. In Figure 1, the stock constantly and smoothly decreases, while in Figure 2, after the exaustion of a resilient response, an exponential decrease triggers the stock reduction, followed by stabilisation.
Figure 3, on the other hand, represents an unstable stock, shifting from one equilibrium to another, where the dotted line represents the unstable condition that will eventually lead to a shock, causing a drastic decrease in stock even with more favourable conditions: restoring the previous state with a backward shift will require bringing the stock back at F1 by lowering unfavourable conditions to a greater extent.
Bibliography:
Baranzini, A. and Carattini, S. (2017) ‘Effectiveness, earmarking and labeling: testing the acceptability of carbon taxes with survey data’, Environmental Economics and Policy Studies, 19(1), pp. 197–227. doi: 10.1007/s10018-016-0144-7.
Bermúdez de Castro, J. M. and Martinón-Torres, M. (2013) ‘A new model for the evolution of the human Pleistocene populations of Europe’, Quaternary International, 295, pp. 102–112. doi: 10.1016/j.quaint.2012.02.036.
Carlsson, F. et al. (2019) ‘Nudging as an Environmental Policy Instrument’, SSRN Electronic Journal. doi: 10.2139/ssrn.3711946.
Carpenter, S. R., Ludwig, D. and Brock, W. A. (1999) ‘Management of Eutrophication for Lakes Subject to Potentially Irreversible Change’, Ecological Applications, 9(3), pp. 751–771. doi: https://doi.org/10.1890/1051-0761(1999)009[0751:MOEFLS]2.0.CO;2.
Crutzen, P. J. (2006) ‘The “Anthropocene”’, in Ehlers, E. and Krafft, T. (eds) Earth System Science in the Anthropocene. Berlin, Heidelberg: Springer, pp. 13–18. doi: 10.1007/3-540-26590-2_3.
Gibbard, P. L. and Walker, M. J. C. (2014) ‘The term “Anthropocene” in the context of formal geological classification’, Geological Society, London, Special Publications, 395(1), pp. 29–37. doi: 10.1144/SP395.1.
Kroeker, K. J., Micheli, F. and Gambi, M. C. (2013) ‘Ocean acidification causes ecosystem shifts via altered competitive interactions’, Nature Climate Change, 3(2), pp. 156–159. doi: 10.1038/nclimate1680.
Kunkel, C. M. and Kammen, D. M. (2011) ‘Design and implementation of carbon cap and dividend policies’, Energy Policy, 39(1), pp. 477–486. doi: 10.1016/j.enpol.2010.08.046.
Levi, S. (2021) ‘Why hate carbon taxes? Machine learning evidence on the roles of personal responsibility, trust, revenue recycling, and other factors across 23 European countries’, Energy Research & Social Science, 73, p. 101883. doi: 10.1016/j.erss.2020.101883.
Lewis, S. L. and Maslin, M. A. (2015) ‘Defining the Anthropocene’, Nature, 519(7542), pp. 171–180. doi: 10.1038/nature14258.
Masclaux-Daubresse, C. et al. (2010) ‘Nitrogen uptake, assimilation and remobilization in plants: challenges for sustainable and productive agriculture’, Annals of Botany, 105(7), pp. 1141–1157. doi: 10.1093/aob/mcq028.
Milazzo, M. et al. (2019) ‘Biogenic habitat shifts under long-term ocean acidification show nonlinear community responses and unbalanced functions of associated invertebrates’, Science of The Total Environment, 667, pp. 41–48. doi: 10.1016/j.scitotenv.2019.02.391.
Niamir, L. et al. (2020) ‘Assessing the macroeconomic impacts of individual behavioral changes on carbon emissions’, Climatic Change, 158(2), pp. 141–160. doi: 10.1007/s10584-019-02566-8.
Ries, J. B., Cohen, A. L. and McCorkle, D. C. (2010) ‘A nonlinear calcification response to CO2-induced ocean acidification by the coral Oculina arbuscula’, Coral Reefs, 29(3), pp. 661–674. doi: 10.1007/s00338-010-0632-3.
Rockström, J., Steffen, W., Noone, K., Persson, Å., Chapin, F. S., Lambin, E. F., et al. (2009) ‘A safe operating space for humanity’, Nature, 461(7263), pp. 472–475. doi: 10.1038/461472a.
Rockström, J., Steffen, W., Noone, K., Persson, Å., Chapin, F. S., Lambin, E., et al. (2009) ‘Planetary Boundaries: Exploring the Safe Operating Space for Humanity’, Ecology and Society, 14(2). Available at: https://www.jstor.org/stable/26268316 (Accessed: 18 March 2021).
Scheffer, M. et al. (2001) ‘Catastrophic shifts in ecosystems’, Nature, 413(6856), pp. 591–596. doi: 10.1038/35098000.
Scheffer, M. et al. (2012) ‘Anticipating Critical Transitions’, Science, 338(6105), pp. 344–348. doi: 10.1126/science.1225244.
Shanableh, A. et al. (2011) ‘Impact of surface ocean acidification on the CO2 absorption rate’, Int. J. of Global Warming, 3, pp. 163–172. doi: 10.1504/IJGW.2011.038377.
Steffen, W., Crutzen, P. and Mcneill, J. (2008) ‘The Anthropocene: Are Humans Now Overwhelming the Great Forces of Nature’, Ambio, 36, pp. 614–21. doi: 10.1579/0044-7447(2007)36[614:TAAHNO]2.0.CO;2.
YongHong, Z. et al. (2010) ‘Progress on preventing and controlling strategies of lake eutrophication in China.’, Environmental Science & Technology (China), 33(3), pp. 92–98.


